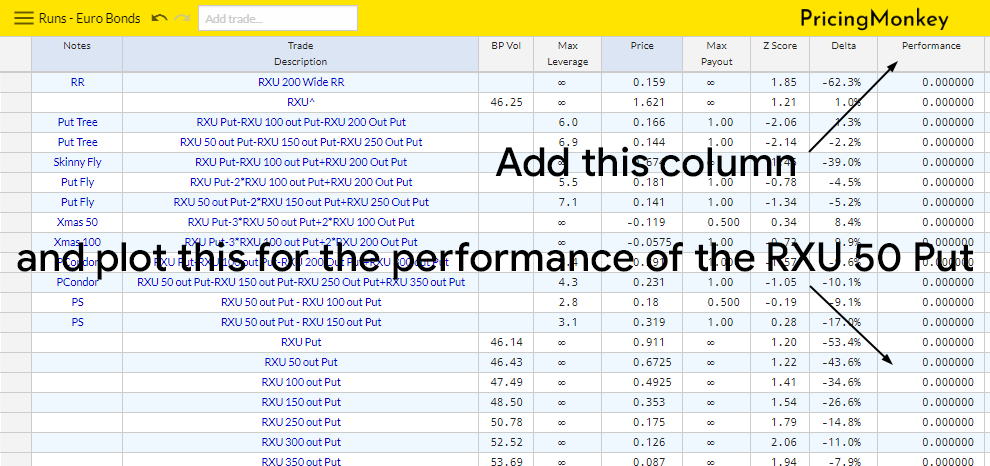
Clients have been asking us for a while to develop functions to allow the performance over time of any strategy or option to be measured and charted. The release of our initial new performance column this week makes the first step in that direction, allow strategies or options to be plotted to see what there historic performance has been to expiry for been.
Example
Sept Bund 174.00 Puts which are approx. 50 ticks out (with delta -.43) from the underlying. Using the performance function you can quickly get a view of how owning 50 tick out Bund Puts have delivered over time.
Charting this performance column using synthetic produces a chart of the history of how 50 out Sep Bund puts would have performed over time, as you can see owning Bund Puts has not been a very good investment on average over the last 7 years, returning a average -.13 ticks.
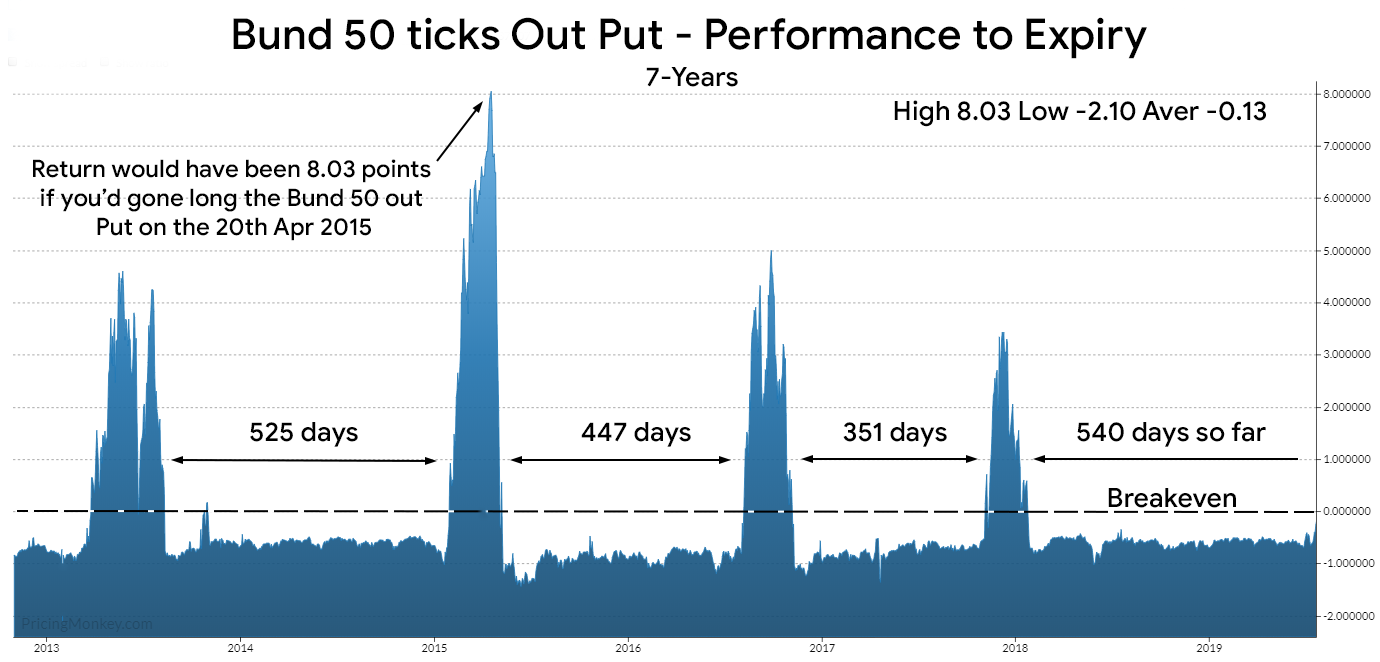
Interestingly Bund Puts do seem to payout on a regular basis, currently a payout probably looks overdue.
This function is still under development with the next steps being to allow selection of dates, for a example adding the ability to analysis the performance of a TY Straddle over payroll.