With the initial shock to the markets seemingly over, and Fed policy set to “easy” to stimulate a recovery, rates markets have been subdued making it harder to see where the next opportunity is. Below we take a look at what’s now priced into options on 10y Treasury futures, focussing on the premium for the US election and find it to be on the expensive side.
Implied vols in TY’s have been grinding lower in a way that is reminiscent of EUR a few years ago where the market continually, but gently, found new lows as a result of persistently low realised in a low rate regime. All the while the two main questions were:
- Where will vol stop grinding lower?
- Is there anything that might send vol higher?
In this post we’re going to look at the latter. For the US the most obvious event on the horizon is the election on the 3rd Nov. Let’s start with a run of TY straddles (using yesterday’s closing vols):
| Expiry | Price (64ths) | Bp Vol | Expiry Date |
| Sep20 | 0-37 | 44.6 | 21-Aug-2020 |
| Oct20 | 1-12 | 47.5 | 25-Sep-2020 |
| Nov20 | 1-36.5 | 49.9 | 23-Oct-2020 |
| Dec20 | 2-08.5 | 58.0 | 20-Nov-2020 |
So the vol surface is upward sloping across all contracts, but there’s a decent bump for Dec, which is first expiry after the election, with Dec 8.1 bp vol over Nov (vs 2.4 for Nov/Oct, and 3.4 for Oct/Sep). How can we gauge if this is a lot though?
To start, we could try and look at what average level of vol would be required between 23rd Oct and 20th Nov, given average vol from today to 23rd Oct is 49.9 and from today to 20th Nov is 58.0. The answer is 76 bp vol. When this rolls to spot you’ll have a 1 month option, so let’s plot 1m ty over the last year and compare to that. I’ve also included 1 month 1y mid-curve eurodollar vols and 1 month S&P options to give a sense of where other implied vols are currently.
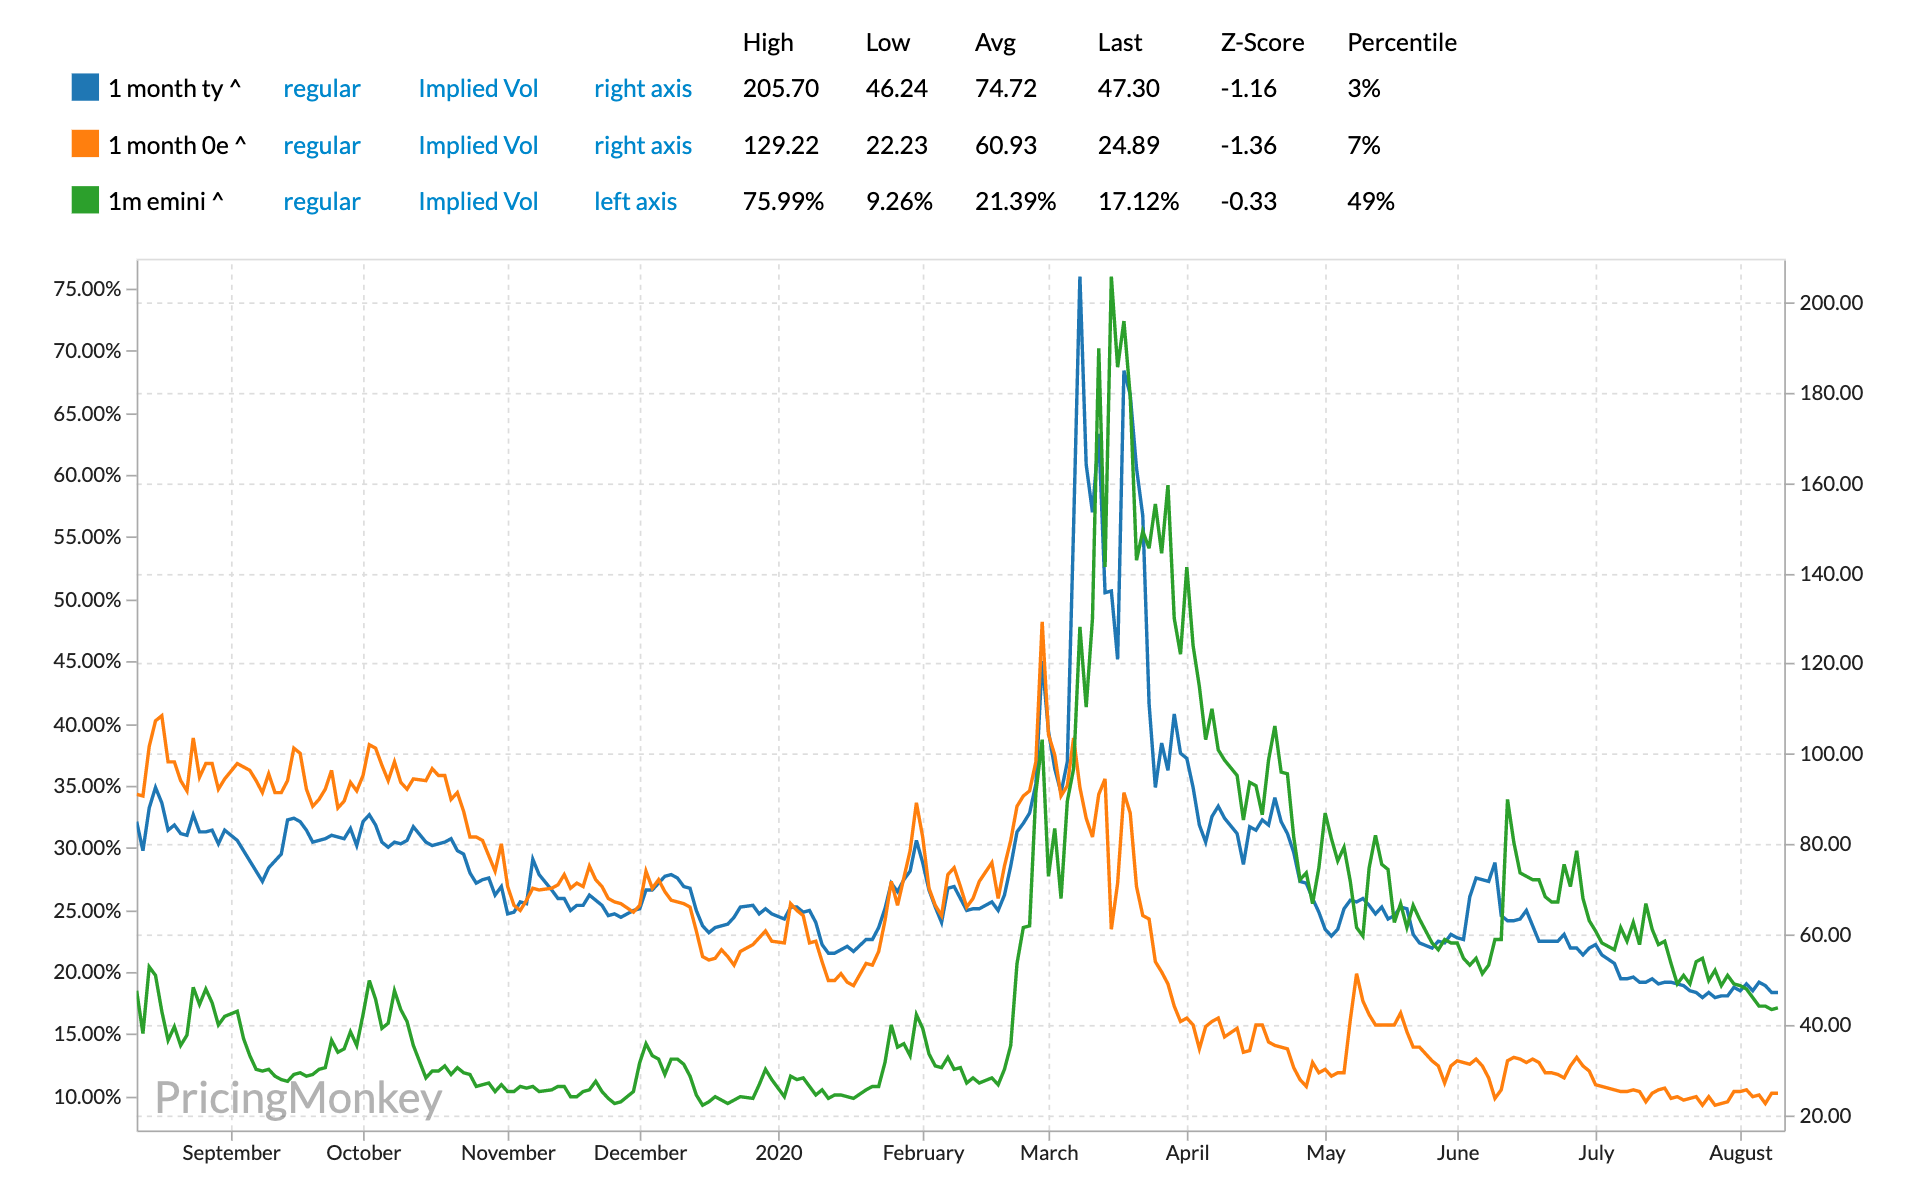
1 month TY is in blue and plotted against the right axis and you can see that a year ago TY vol was tracking around 80 bp vol. At first glance it seems to suggest a temporary return to pre crisis behaviour. So, looks about right? This seems a bit simplistic. Does it really make sense that rates behave like they did pre crisis for an entire month while the fed is probably still going to be keeping policy easy? Also, with big events most of the volatility is usually in the few days after the event as the market reprices following the result. What are the macro outcomes here? Treasuries sell off on concerns of fiscal irresponsibility? Seems unlikely while we have QE. Treasuries rally hard? Experience in EUR was that bonds can certainly rally, but not very quickly.
Let’s revisit this forward vol calculation only this time let’s look at what implied vols you get if you assume only some of the days in the period are “high vol”, and the rest are the same as the run up to the election.
| High Vol Days | High Vol |
| 5 | 123 |
| 10 | 94 |
| 15 | 82 |
| 19 | 76 |
If the volatility is concentrated into 10 business days (or 2 weeks) now the “high vol” required is 94 bp vol. Versus a baseline of around 50abpv this is starting to feel like a pretty big premium.
How about comparing with another market like equities? Things are a bit easier here as VIX futures are roughly speaking futures contracts for forward vol. The expiries are only slightly different to TYs too which makes them easier to compare although you need to bear in mind that the contract that corresponds to the Nov/Dec forward vol in TYs would be the Oct Future . The price of the contract is equity vol in %. I’ve added the forward vol for TYs for the matching periods in the final column.
| Month | Vix Future | Vix Expiry | TY Forward |
| Sep20 | 27.1% | 16-Sep-2020 | 53 |
| Oct20 | 30.0% | 21-Oct-2020 | 76 |
| Nov20 | 28.6% | 18-Nov-2020 |
So there’s a bump here too although it seems to be much smaller in proportion to the level of vol. This is to be expected to some extent as equities are still elevated vs their pre Coronavirus levels, but in my opinion this still looks pretty small.
If you are still with me and think it’s worth looking at ways to sell this, the question becomes how. Ideally I think you’d look at trying to buy the Jan expiry vs selling Dec but unfortunately Jan options aren’t really trading yet so for now it’s just something to add to your sheets. Plan B is to sell Dec vs Nov. Given I’m a reformed EUR gamma trader, I’m much less afraid of the gap higher on the rally than the sell off, so I’d look at selling 2 point out calls in Dec vs buying 2 point out call in Nov and run it gamma hedged. If the market ralles before Nov expiry, I’d look to roll the strikes in Dec up to reduce the chance of going into the event short low (price) strikes.
The main risk to this trade is that the market moves to the strikes into the Nov expiry but doesn’t realise much before the event, but the election looks likely to have a big impact, and you are left short some Dec options that are tricky (ie expensive) to cover. Perhaps the flip side of this is that it provides an explanation of why the pricing looks high in the first place and it gels with the theme of reduced risk appetite following the big moves at the start of March.